

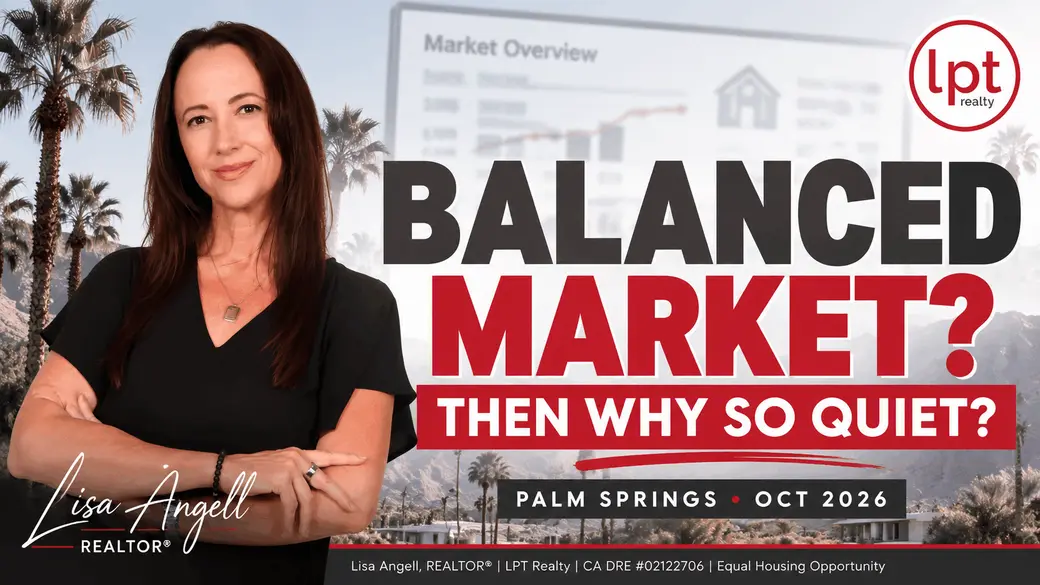
Palm Springs Housing Market Update: Why the October 2026 Numbers Tell a Complicated Story
October 29, 2026 | By Lisa Angell, REALTOR® | LPT Realty
If you've been following real estate headlines lately, you might be wondering what's actually happening in the Palm Springs and Coachella Valley housing market.
Are we in a buyer's market? Is it balanced? Are sellers still getting their asking prices? And why do some homes seem to sit on the market with barely a showing?
The answers are more complicated than a simple market gauge would suggest.
I've been in real estate for more than 27 years, and if there's one thing experience has taught me, it's that statistics need context.
So let's look at what September's numbers tell us, what we're seeing in October, and what buyers and sellers might want to consider heading into the final months of 2026.
To Watch My Full Update Click Here
First, Is This Really a Balanced Market?
One of the most commonly used measurements of housing market conditions is months of inventory.
It estimates how many months it would take to sell the currently available homes if sales continued at the recent pace and no new homes were added.
As a general guideline:
-
Under 3 months often suggests conditions favoring sellers.
-
Approximately 4 to 6 months is often considered balanced.
-
More than 6 months can suggest conditions favoring buyers.
These aren't universal rules, and every price range and neighborhood has its own dynamics.
But here's where it gets interesting.
A market can look balanced based on months of supply while both inventory and sales activity are declining.
And that's an important part of what we're seeing in the Coachella Valley.
September 2026: Less Inventory, but Also Fewer Sales
The September market report I reviewed showed several notable year-over-year changes.
Closed unit sales declined from approximately 377 in September 2025 to 336 in September 2026, a decrease of about 11%.
Available inventory also declined, from approximately 2,800 homes to about 2,200.
The report showed approximately a 22% decline in months of supply, alongside reduced inventory.
At first glance, less inventory might sound like great news for sellers.
After all, fewer homes available means less competition, right?
Potentially. But it doesn't automatically mean buyers are more active.
When both inventory and transactions decline, the market can feel unusually quiet even though the supply indicator looks relatively healthy.
That's the distinction I think is important.
A balanced inventory number doesn't necessarily mean a balanced experience for buyers and sellers.
Price Reductions and Negotiation Matter
Another interesting September statistic was the average price per square foot, which declined approximately 4.3% year over year.
The reported median home price also shifted from approximately $620,000 in September 2025 to $612,000 in September 2026.
That's a modest change in the median, but it's worth looking at alongside negotiated prices and reductions from original asking prices.
When sellers initially list at a higher price, make reductions over time, and then negotiate further before closing, the difference between their original asking price and final sales price can become significant.
For example, a 7% difference on a home originally priced at $500,000 represents $35,000.
Not exactly pocket change!
This doesn't mean every home is selling at a substantial discount. Some properties are competitively priced from the beginning and sell with fewer adjustments.
But it does reinforce why pricing strategy matters so much.
October 2026: What the Latest MLS Numbers Show
On October 29, I pulled a current snapshot directly from the MLS for detached single-family homes across the Desert Cities.
Here's what I found:
| Market indicator | October 29, 2026 |
|---|---|
| Active and coming-soon listings | 1,995 |
| Active under contract and pending | 396 |
| Closed in previous 30 days | 304 |
| Average reported days on market for recent closings | 60 |
| Average closed price | $948,311 |
Using the 304 sales closed during the previous 30 days, the market had approximately 6.56 months of inventory.
Using the 396 homes under contract or pending, the active-to-pending ratio was approximately 5.04.
Those two indicators tell slightly different stories.
Recent closed sales reflect transactions that were negotiated earlier. Pending contracts provide a more current picture of buyer activity, but they haven't all closed yet.
Taken together, these figures suggest a market that is roughly balanced to mildly buyer-favorable, depending on the measure.
In other words, neither a dramatic crash nor a particularly strong seller's market.
Why the $948,311 Average Price Needs Context
That average closed price might surprise you.
It certainly caught my attention!
One reason is that several exceptionally expensive homes closed during this reporting period, including properties in the luxury Hideaway community.
When a small number of multimillion-dollar properties sell, they can significantly raise the arithmetic average.
That's why I always recommend looking at median sales prices, comparable properties and individual market segments rather than relying solely on a valley-wide average.
A $948,311 average doesn't mean the typical home in every Desert City is selling for nearly a million dollars.
The type of home, community, amenities, location and price range all make a difference.
A Word About Days on Market
The October MLS snapshot showed an average of 60 reported days on market for homes closed in the preceding 30 days.
But there's an important limitation.
When a property is withdrawn or expires and later gets relisted, the days-on-market figure displayed on a particular report may not represent its full marketing history.
For example, a home could be listed for several months, removed from the market, and then relisted before eventually selling.
Depending on the MLS reporting method, the displayed days may not fully capture the total exposure.
This is why I look at listing histories, price changes, showing activity and comparable sales together when advising sellers.
Why Mortgage Rates Are Such an Important Part of This Story
Mortgage rates have continued to influence buyer purchasing power.
The Federal Reserve held its benchmark interest rate steady on October 28, 2026. Meanwhile, Freddie Mac reported an average 30-year fixed mortgage rate of 7.24% on October 29.
And while the Fed's benchmark rate matters, mortgage rates are more directly influenced by longer-term bond yields, market expectations and lending conditions.
Higher mortgage rates can make monthly payments substantially more expensive, even when home prices haven't changed dramatically.
For buyers who need financing, affordability can determine whether they're ready to purchase now or would rather wait.
For sellers, fewer financially comfortable buyers can mean less activity and more competition for those who are ready to purchase.
Could We See More Activity During the Holidays?
Here's where things get interesting.
Our Coachella Valley market has traditionally had its own seasonal patterns.
We're a destination market, and many buyers spend time here during the cooler months. Summer activity often looks quite different from spring and winter activity.
But in recent years, economic uncertainty, interest rate fluctuations and changing buyer behavior have disrupted some of those familiar patterns.
I've personally observed periods when activity picked up at times I wouldn't normally have expected.
Could something similar happen as we move through the holidays?
Possibly.
If mortgage rates improve, economic uncertainty eases, or buyers who have been sitting on the sidelines decide they're ready, we could see activity at a time when the market might otherwise be quieter.
But that's a possibility, not a prediction.
There are still plenty of variables, and nobody knows exactly which direction they will move.
What This Means if You're Selling
If you're currently selling or considering listing your home, I'd encourage you to focus on the factors you can control.
Price realistically from the beginning. Today's buyers have access to extensive listing information, and many are paying close attention to value.
Watch your competition. Your home isn't competing against every property in the Coachella Valley. It's competing with comparable homes that prospective buyers would realistically consider.
Evaluate the complete marketing strategy. Photography, presentation, online visibility, property condition, showing access and pricing all contribute to the result.
Stay flexible. Market conditions can change, and an effective selling strategy should be reviewed regularly.
And if selling isn't necessary right now, it may be perfectly reasonable to evaluate the costs and benefits of waiting.
Every homeowner's circumstances are different.
What This Means if You're Buying
For buyers, there may be opportunities worth exploring.
When listings spend longer on the market or sellers become more flexible, buyers may have additional room to negotiate price, closing costs, repairs or other terms.
Of course, that doesn't mean every seller is desperate or every listing is overpriced.
Well-positioned homes can still attract strong interest.
But if you're prepared financially and understand your monthly payment, this could be a market worth paying close attention to.
Just remember to evaluate the total cost of ownership, including HOA fees, insurance, utilities and any additional community-specific expenses.
The Most Important Takeaway: Real Estate Is Local
Palm Springs, Palm Desert, Rancho Mirage, La Quinta, Indio, Indian Wells, Cathedral City and the surrounding communities do not all behave identically.
Even within a single city, different neighborhoods and price ranges can have dramatically different inventory levels and sales activity.
That's why I don't recommend making a major real estate decision based solely on a national headline or one valley-wide statistic.
The most useful analysis is the one that applies to the property you're buying or selling.
And as someone who is currently experiencing this market firsthand as a seller, I understand how frustrating a quieter market can feel.
I've seen encouraging signs of activity recently, but we'll need more data to know whether that develops into a sustained change.
For now, my message is simple: Understand your specific market, have a strategy, and make decisions based on your own goals rather than the headlines.
Want a Market Update for Your Neighborhood?
If you're wondering what homes are actually selling for in your community, how much competition there is, or whether now makes sense to buy or sell, I'd be happy to help.
You can request a personalized neighborhood market snapshot or contact me for a conversation about your plans.
Lisa Angell, REALTOR® | LPT Realty | CA DRE #02122706
760-423-3443 | [email protected] | angellrealestate.com
Equal Housing Opportunity
Market statistics reflect the sources and reporting dates discussed above. October MLS data is preliminary and subject to change. Housing market indicators are general guides, not guarantees of future results.
Categories
Recent Posts







"My goal is simple: to help you feel confident, informed, and taken care of every step of the way.”
GET MORE INFORMATION